SVG shapes
ReportWorkshop uses shapes. Their primary purpose is to visualize values within table cells. For example, you can specify that a certain shape should be repeated a number of times proportional to a value (such as a star rating).
Shapes can also be used as components and as TRichView document items.
Before this version, several predefined shape types were supported, including circles, regular polygons, stars, gears, flags, smileys, and several other shapes.
You can now extend these shapes with custom ones defined using SVG paths.
When I added this feature, I had to decide where SVG paths should be stored: in the application (for example, as a property of TRVReportGenerator), in the RVF document (so that a single list would be available to all value visualizers and document items), or individually in visualizers and elements. Each of these options has its own pros and cons.
In the end, I chose the second option — storing them in the document itself, that is, in the
DocObjects collection.
The DocObjects collection contains items that are saved together with the document in RVF format. This collection is unusual in that it typically contains items of different classes.
In particular, to store SVG paths, the
TRVSVGPathsDocObject class was implemented. This class has a Paths property, which is a collection of named SVG paths. Value visualizers and document items can refer to an SVG path by its name in this collection.
It is assumed that an item of type TRVSVGPathsDocObject is added to the collection as a single instance. For convenience,
a set of helper functions is provided to work with this object.
Here is the example how to add two SVG paths in a document.
If you use RichViewActions, the best place for this code is TrvActionNew.OnNew event (it occurs when creating a new empty document).
Code: Select all
const
  LampStr = 'M480-80q-26 0-47-12.5T400-126q-33 0-56.5-23.5T320-206v-142q-59-39-'+
    '94.5-103T190-590q0-121 84.5-205.5T480-880q121 0 205.5 84.5T770-590q0 77-35.5'+
    ' 140T640-348v142q0 33-23.5 56.5T560-126q-12 21-33 33.5T480-80Zm-80-126h160v-'+
    '36H400v36Zm0-76h160v-38H400v38Zm110-118v-108l88-88-42-42-76 76-76-76-42 42 88 '+
    '88v108h60Z';
  SailStr = 'm120-420 320-460v460H120Zm380 0q12-28 26-98t14-142q0-72-13.5-148T500-'+
    '920q61 18 121.5 67t109 117q48.5 68 79 149.5T840-420H500ZM360-200q-36 0-67-'+
    '17t-53-43q-14 15-30.5 28T173-211q-35-26-59.5-64.5T80-360h800q-9 46-33.5 84.'+
    '5T787-211q-20-8-36.5-21T720-260q-23 26-53.5 43T600-200q-36 0-67-17t-53-43q-'+
    '22 26-53 43t-67 17ZM80-40v-80h40q32 0 62.5-10t57.5-30q27 20 57.5 29.5T360-'+
    '121q32 0 62-9.5t58-29.5q27 20 57.5 29.5T600-121q32 0 62-9.5t58-29.5q28 20 58'+
    ' 30t62 10h40v80h-40q-31 0-61-7.5T720-70q-29 15-59 22.5T600-40q-31 0-61-7.5T480-'+
    '70q-29 15-59 22.5T360-40q-31 0-61-7.5T240-70q-29 15-59 22.5T120-40H80Z';

var
  DocObject: TRVSVGPathsDocObject;
begin
  DocObject := GetSVGPathDocObject(MyRichView, True);
  with DocObject.Paths.Add do
  begin
    Path := LampStr;
    Name := 'lamp';
    ViewBox.SetValues(0, -960, 960, 0);
  end;
  with DocObject.Paths.Add do
  begin
    Path := SailStr;
    Name := 'sailing';
    ViewBox.SetValues(0, -960, 960, 0);
  end;

end;
SVG shape (fish) was added to the collection of SVG paths, so it can be used in visualizers of values:
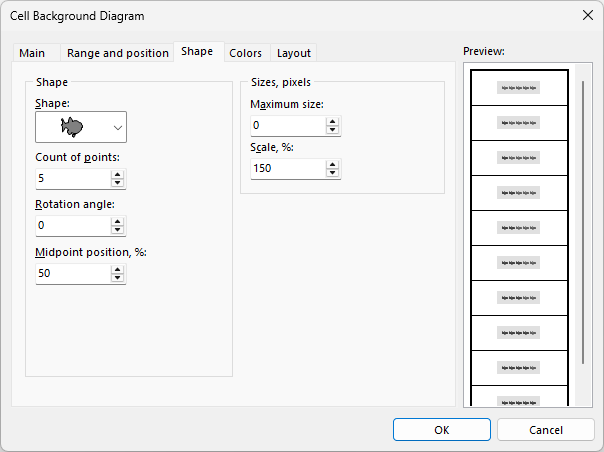
- SVG-in-visualizer-dialog.png (18.83 KiB) Viewed 3396 times
Report:
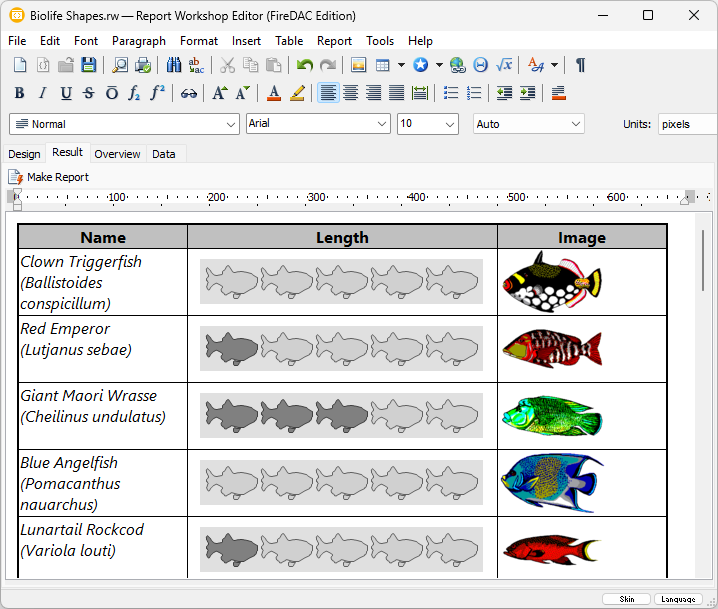
- SVG-in-report-result.png (107.67 KiB) Viewed 3396 times